Virtual CISO · Reporting
The report your board reads, built from the same data we work from
The usual security update is assembled the week before the meeting, from a system nobody else in the room has seen, by somebody who knows which numbers to leave out. Yours comes out of the place the work actually happens, which is a harder document to write and a much easier one to believe.
A posture score is only worth the log underneath it
A single figure out of ten is the one thing that survives a board meeting intact, so it is worth having. On its own it is also the easiest number in the business to produce, which is why nobody senior quite believes one.
Underneath yours sits the event log: every change that moved the score, what it was, and when. That turns “we went from 4.1 to 7.2 this year” from an assertion into something anyone in the room can open and walk back through. The same screen carries compliance progress per framework rather than one blended percentage, and the external findings counted by severity.
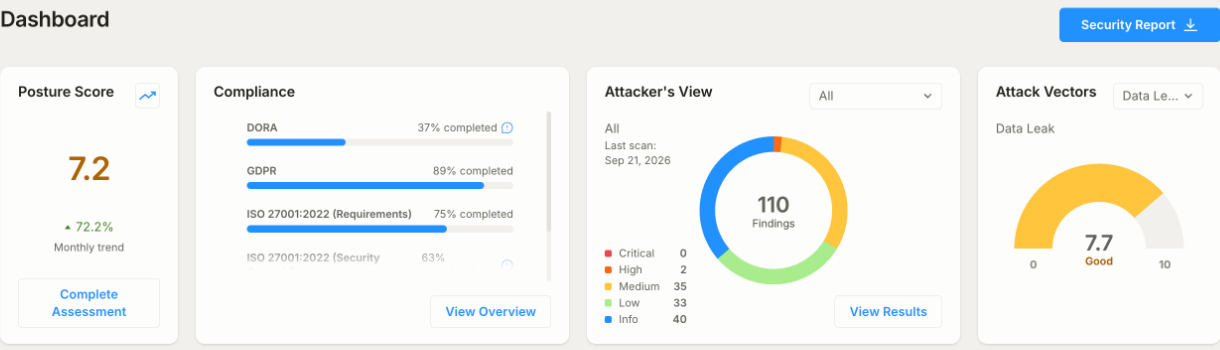
- A posture score from 0 to 10, with the month-on-month movement beside it
- An event log of every change that moved it, and when it was made
- Compliance progress per framework, never averaged into a single number
- External findings counted by severity rather than described in a paragraph
Scored by what could actually happen to you
Domains and controls are our vocabulary, not your board’s. A director does not think in access management; they think in outcomes, and about whether this one would end up in the trade press. So the same posture is also scored by outcome, on the same scale.
- 01
Data leak
Customer records, contracts, drawings, payroll — the material whose exposure is a notification duty and a conversation with your biggest account rather than an IT incident.
- 02
Website defacement
The smallest technical event with the largest audience. It scores separately because the controls that prevent it sit with a web agency more often than with anyone on your payroll.
- 03
Ransomware
The one every board has already read about. Scored across the whole chain that matters — how it gets in, how far it travels, and whether the backups would really bring you back.
- 04
Fraud
Invoice redirection, impersonated executives, payment changes agreed over the phone. Mostly a process and training problem, which is why it tends to score differently from the rest.
The target line is the point, not the shape
Every security domain is scored against a target set for your organization — your size, your sector, your obligations — rather than against a maximum. Ten everywhere is nobody’s goal and nobody’s budget, and a chart that implies otherwise is a chart that will be ignored by the second quarter.
So the useful reading is the distance between the two lines, and the filter that matters is the one showing only the domains under target. That short list is the agenda, and everything on it has tasks against it on the remediation roadmap, which is where an agenda turns into dates. The rest is evidence that the work already done is holding.
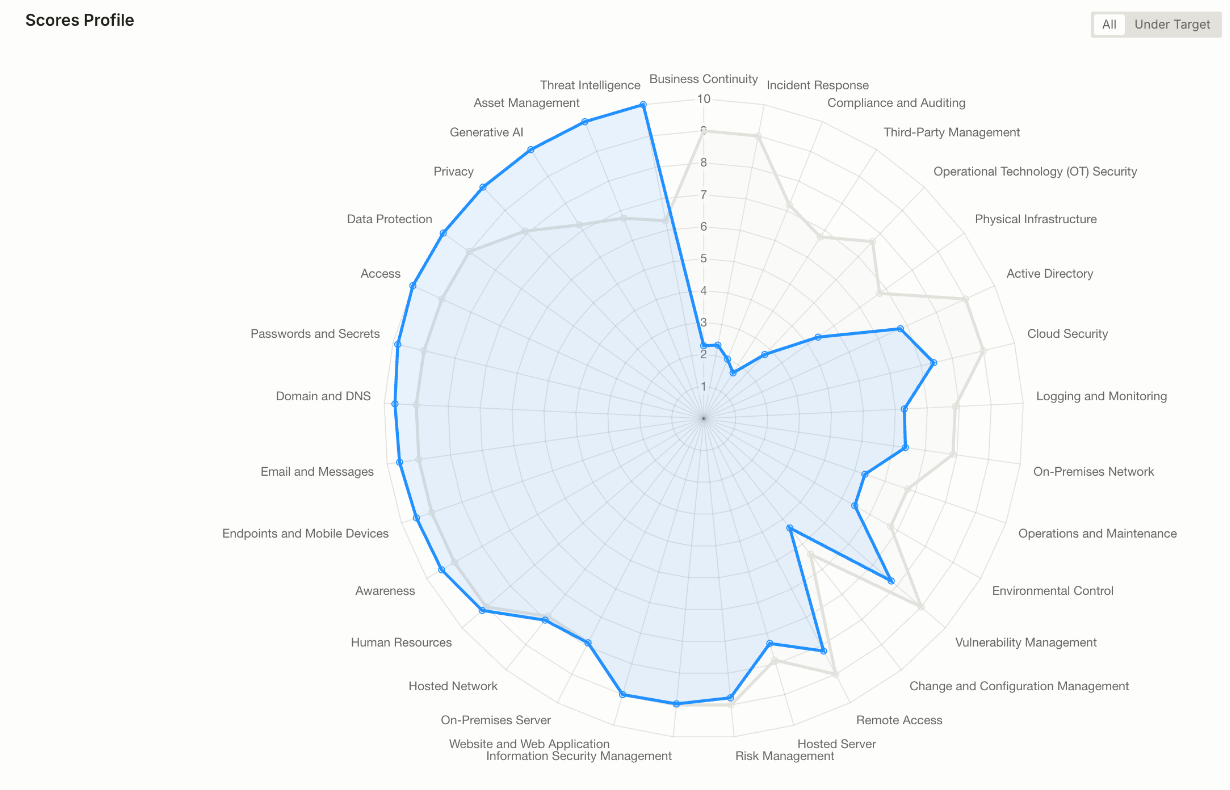
- Each domain scored against a target for your organization, not against ten
- An under-target filter, which is the only part of the chart that needs a decision
- The same domains your task list and your risk register are organized by
- A shape that changes between quarters, which is what a trend actually looks like
One document, written for people who were not in any of the meetings
The monthly report is a single document rather than a folder of exports, and it is ordered the way a reader who was not there needs it: what the business is trying to protect, where the posture stands, what was found, what it would cost you, and what happens next.
It is produced on demand as well as on schedule, so the version that goes into a board pack is the state of play on the day the pack was built rather than whenever the last cycle happened to end.
- Your business objectives, in your words, because everything after this is measured against them
- The posture score and the movement since the last report
- Findings, external and internal, with what each one actually exposes
- The risk matrix, inherent against residual, and the key risks pulled out
- The supplier picture, which is where most of the uncomfortable surprises live
- The mitigation plan, and the ten tasks that matter most before the next report
An auditor, a customer and an insurer each want a different document
Sending the board report outward is a mistake in both directions: it says too much about your weaknesses and too little about the specific thing the reader came for. So the same underlying data is published in separate shapes.
- 01
For the auditor
The compliance report: the controls of one framework, their status, and the work behind each one, in the order the framework itself is written.
- 02
For the customer
A supplier-facing picture of your own posture — what you assess, how often, and what you do about what you find — for the questionnaires that now arrive with every renewal.
- 03
For the insurer
The external exposure view: what an attacker can see from outside without any cooperation from you, and what has been closed since the last look.
- 04
For continuity planning
The business impact analysis: which processes matter, how long each can be down, and what the dependencies underneath them are.
Every figure is read, not re-keyed
The report is produced from the system the work happens in. No spreadsheet sits between the two, so a number in the board pack and the same number on the screen cannot quietly come apart — which is the usual failure of security reporting, and roughly why a board stops believing the deck somewhere around month four.
Nor does anyone have to wait for the cycle. Your management can look at the same screens read-only, whenever they want, and the report is then a summary of something they could already see rather than the only window they are given.
Frequently asked questions
The questions we hear most often from security and IT leaders.
Something not covered here? Ask us directly
A management report every month and a fuller pack for the quarterly review — and beyond that, a report can be produced on any day you need one, which in practice matters more than the cadence does. Your lead vCISO writes the reading of it. The figures come out of the system automatically; what they mean, what we recommend, and which decisions we need from you do not, and that is most of the value of the document.
Not the management report, and we would argue with you about it. That one is written for people who are entitled to know exactly where you are weak, and that is a short list. What goes outward is a separate document aimed at its reader: a compliance report for an auditor, a supplier-facing summary for a customer questionnaire, an external exposure view for an insurer. Each carries what that reader needs and leaves out what they have no business seeing. Sending it is your decision and your signature, not ours.
No, and anybody offering you a league table is selling you one. The score is calculated against a template chosen for your size, sector and obligations, and against targets set for your organization — so two companies showing the same figure have been measured against different things, and the comparison is noise. What is worth comparing is you against yourself: same scope, same template, month after month. The one layer measured identically for everyone is external exposure, what an attacker can see from the internet without any cooperation from you, which is why that part is reported separately.
Open it. Every bit of movement traces back to the tasks that closed in the period, and a task only reaches done after review, so nothing moves the figure because somebody ticked a box on a Friday afternoon. For anything an outsider can see there is a second check on top: a closed task whose finding still shows up in the next scan comes back open. The uncomfortable half of the same mechanism is worth saying out loud — when the number falls between two reports, you will see that too, with the same log underneath it.
Where this sits, and what comes next
Ready to get started?
Partner with Spirity Enterprise to implement the right security and IT solutions for your organization.